By: Angelina Davis
Data collection has been an integral part of my Global Scholars experience. Without it, I would have nothing to show for the work I have been doing. Since my experience is remote, no interviews or surveys are being conducted – an introvert’s dream, but a challenge to navigate while trying to build a meaningful summer experience. When visualizing taking an “active role” in data collection, I personally envision a researcher running around a new city & connecting with locals to get the inside scoop. My own “active role” is a run that looks effortless from the outside looking in, but actually is painful and leaves you with a side stitch. Only the strong survive!
The truth is, it is easy to oversimplify the research that one is conducting. My elevator sentence, “I code articles about Alzheimer’s predictors,” fails to highlight the complexity and importance of the project I am a part of. In reality, I am going through 20+ pages of medical journals and studies that have field-specific jargon, such as cognition tests related to various cognitive domains. I navigate through studies to find global information and statistically relevant outcomes that are then coded through an online platform. Over the last month, I have begun to familiarize myself with some of the memory and learning tests administered to adults with minor cognitive impairment – this has been a huge win, and has made my workload move more quickly.
My role in my summer experience is built on the foundation of excessive amounts of caffeine and acknowledging gaps in my knowledge. A misconception I had before working on this project was that the majority of Alzheimer’s and mild cognitive impairment research was being produced by the United States. Survey says? Wrong! Every peer-reviewed article I have extracted data from has been from a different country, such as Canada, Spain, and even Brazil. My initial thoughts show that misunderstandings about the origins of research might be more common than I thought. The perspective I had focused more on the shortcomings of inclusivity in research, while there may be more representation in the studies than I initially thought.
If this representation does exist & continues to show up in the articles I am going through, then I think it is extremely important to highlight it and present it. Analyzing what went right is just as important as looking at what went wrong. That is how society continues to put out good research that is representative of multiple populations instead of one, oddly specific one.
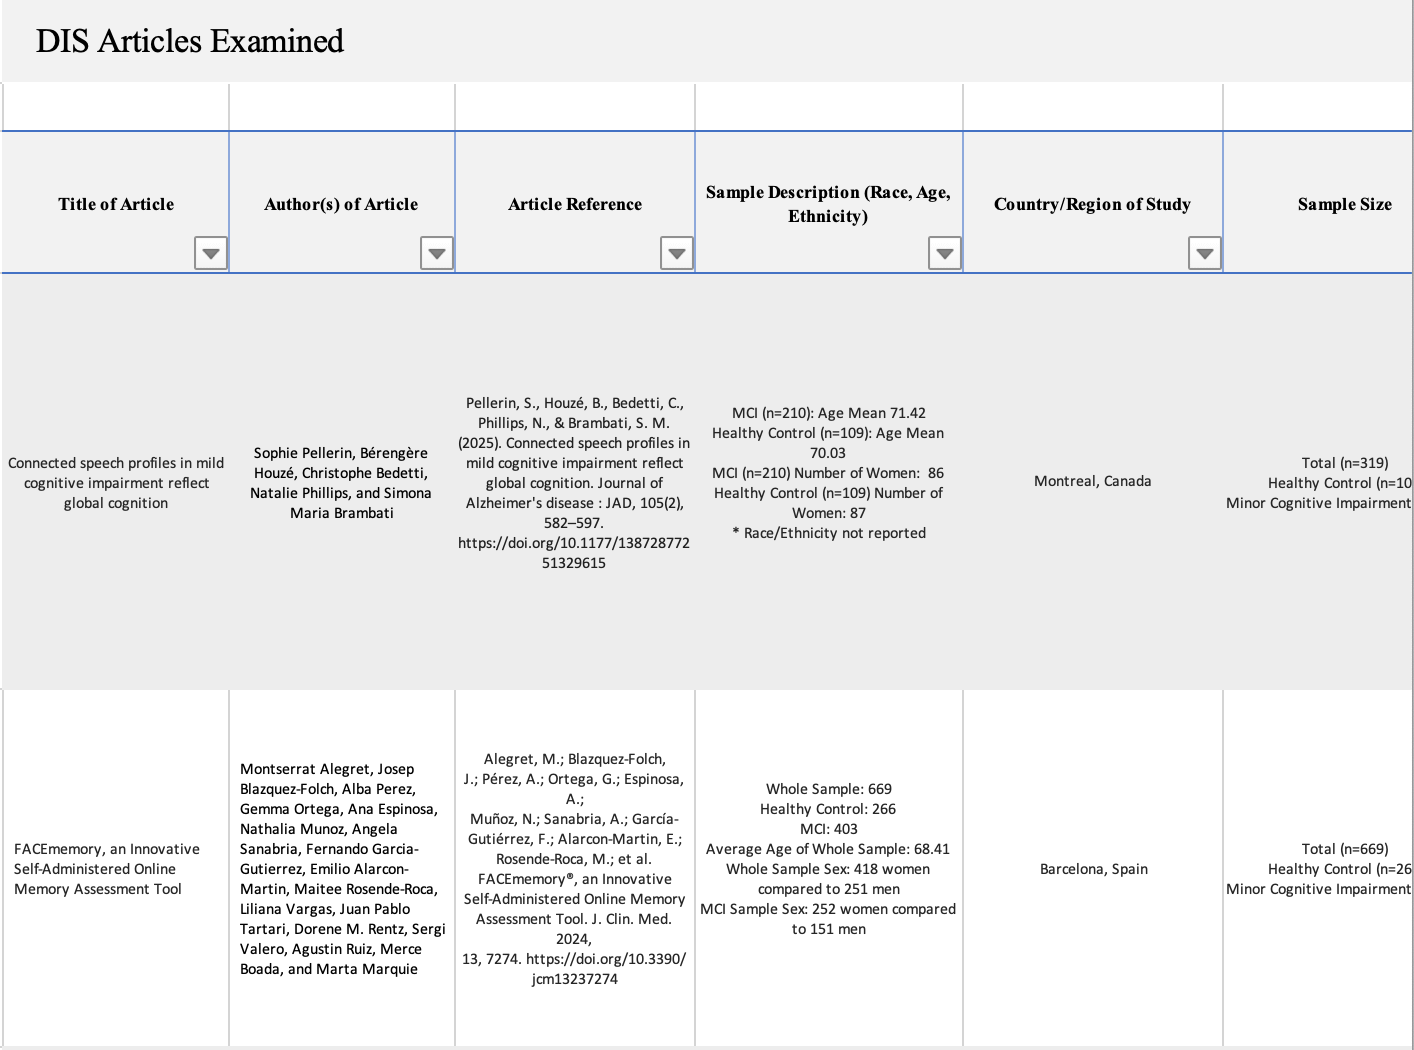
I have mentioned my documentation process for data collection a couple of times, but it is essential to my experience, so there is no harm in detailing it again. Months ago, I created an Excel spreadsheet that consists of columns: “Title of Article, Author(s) of Article, Article Reference, Sample Description (Race, Age, Ethnicity), Country/Region of Study, Sample Size, Author Location, Predictor Identified (Biological or Lifestyle), Global Notes”. This sheet is filling up fast and highlights accessibility and accomplishments of the studies while simultaneously making it easy for me to track shortcomings of the research. My Excel spreadsheet keeps all of the articles organized so that information does not get mixed up. It is also easy to update so that I do not fall behind on data entry. A bonus is that I feel really cool filling it out. Below, I have attached a sneak peek of my Excel sheet so that you can get excited for my final findings!